Microbiology testing of soil, organic matter and water
Microbial Management Systems is an Australian laboratory that undertakes microbiology testing of soil, organic matter and water. Our clients include mining companies, farmers and horticulturalists, fertilizer and compost suppliers, and golf courses.
Our services include:
- microbiology testing of environmental samples
- soil management solutions through the restoration and building of microbial communities
- microbial solutions for bioremediation and waste management issues
Microorganisms are vital to soil health through their role in nutrient cycling, plant establishment and growth, geochemical transformations, and soil formation. Their activities largely determine soil biological properties which, in turn, influence soil quality and health.
If you test for the chemical and physical quality of your soils you should also test for their biological quality. Microbiological changes in soils occur more rapidly than chemical or physical changes and provide a rapid and sensitive means of characterising soil quality.
If you use products to improve soil and plant health we can provide an independent test of their effects on your soil microbiota. Did you know that a simple increase in the soil moisture content can result in a several-fold increase in the soil biomass? And contrary to some claims, composts, microbially-enhanced fertilizers and other soil treatments (such as compost teas) rarely introduce significant numbers and diversities of beneficial bacteria and fungi into agricultural soils? Rather than being a source of microorganisms, these additives are simply an additional source of nutrients available to the microorganisms already present in the soil.
If you don't know the microbial status of your soils you are not getting the full picture of your asset.
Charting microbial status
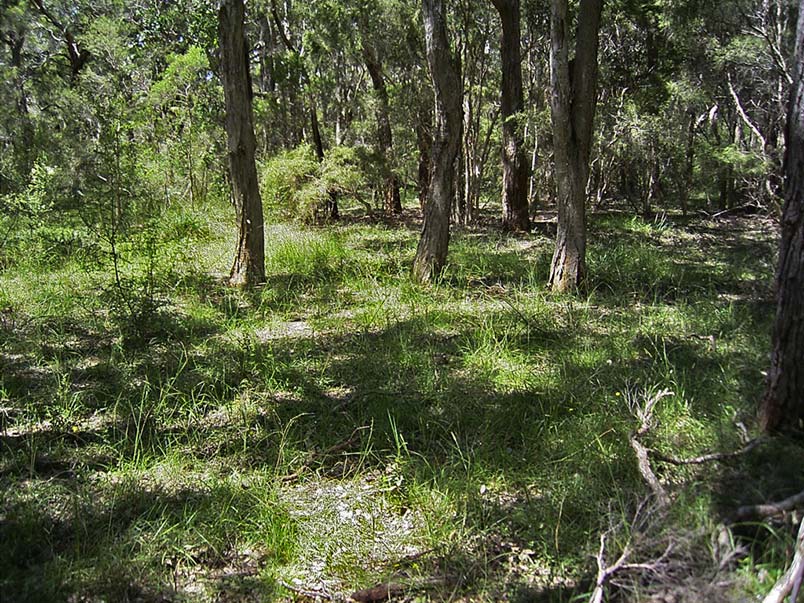
Native vegetation
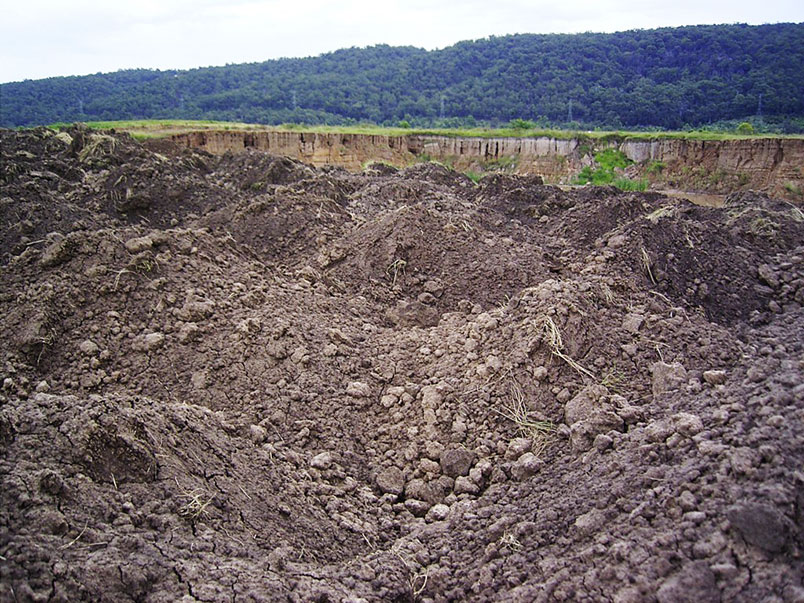
New topsoil stockpile
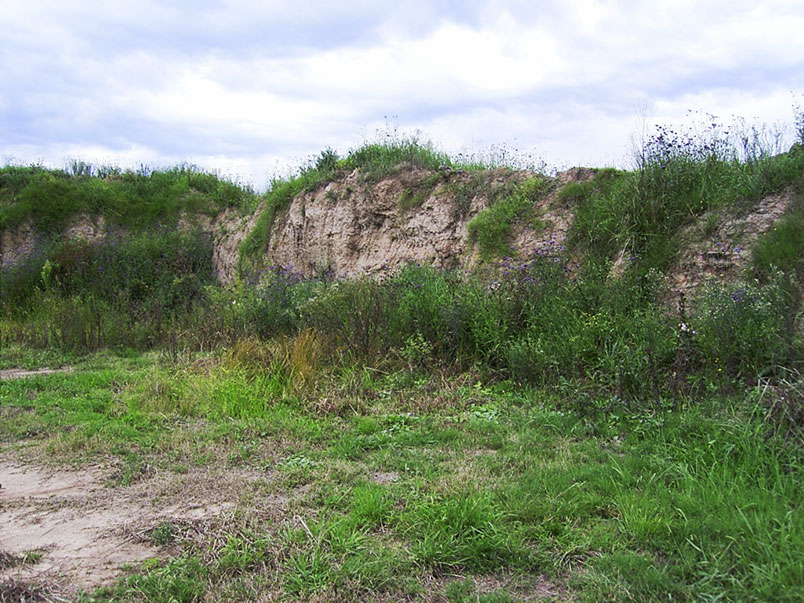
Old topsoil stockpile